Posts Tagged ‘Stocks’

Technical Trading – Stochastics

Tuesday, July 6th, 2010

The technical indicator called Stochastics is used to determine patterns of uptrends and downtrends in a stock’s trading pattern. The oscillation of the Stochastics shows you when a stock is nearing or within an oversold area or nearing or within an overbought area.

Stochastics come in two main varieties, fast and slow. Both are graphed between 0-100, where over 80 means overbought and under 20 means oversold.
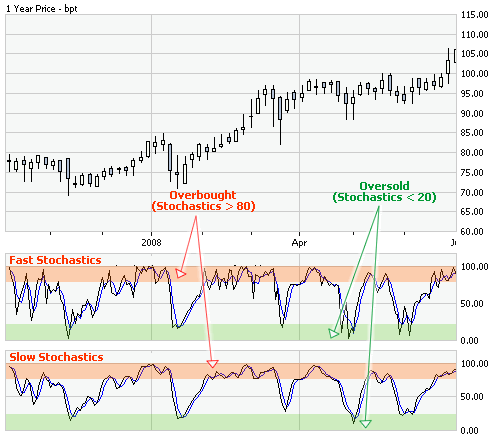
Stochastics Fast

The Stochastic Fast is charted using the following two lines.

Fast %K: [(Close – Low) / (High – Low)] x 100 (shown as black line above)
Fast %D: Simple moving average of Fast K (3-day MA) (shown as blue “trigger line” above)

Stochastics Slow

The Stochastic Slow is charted using the following two lines.

Slow %K: Equal to Fast %D (3-day MA of Fast %K) (shown as black line above)
Slow %D: Simple moving average of Slow %K (shown as blue “trigger line” above)

Which is better? Well, the Stochastics Slow is usually preferred by most traders because is does not show as many false buy and sell signals.

Stochastic Price Divergences

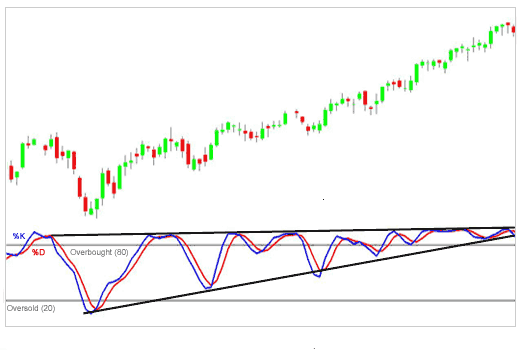
One other aspect of Stochastics that I would like to touch on are Stochastic Price Divergences. This occurs when the Stochastics begins to oscillate within a smaller and smaller range. If the narrowing range is encompassing high numbers around 70 and above then this is a very strong bullish signal. The opposite is also true, if the narrowing range is encompassing low numbers below 30 then this is a very bearish signal.

Below is an example of a bullish Stochastic Price Divergence.
Wall Street rises with euro and data. Boeing (NYSE:BA) Caterpillar (NYSE:CAT)

Tuesday, June 15th, 2010

By Rodrigo Campos

NEW YORK (Reuters) – Stocks rose on Tuesday as the euro strengthened after successful European debt auctions and U.S. data showed inflation remained under control.

The euro, a yardstick used by equity investors to gauge risk appetite, rose above $1.23 to its best level since June 3, even after a survey showed German analyst and investor sentiment fell more than expected.

Industrial and technology sectors, with high exposure to Europe, led the U.S. advance, with planemaker Boeing Co (NYSE:BA -News) up 3 percent to $66.78, while Caterpillar Inc (NYSE:CAT -News) added 2 percent to $62.17.

The move is “all related to the euro. It determines how the stock market behaves,” said Joseph Battipaglia, market strategist at Stifel Nicolaus in Yardley, Pennsylvania.

“On a day-to-day basis, a trade keying off on where the euro is seems to be the only trade that works. Until that measure stops working, they’ll keep doing that trade. It doesn’t inspire confidence,” he said.

[–quote–]

New York state manufacturing continued to grow in June although employment fell sharply, while in a separate report U.S. import prices posted their largest decline in nearly a year in May, bolstering views of tame inflation and low interest rates.

The Dow Jones industrial average (DJI:^DJI – News) gained 98.17 points, or 0.96 percent, to 10,289.06. The Standard & Poor’s 500 Index (^SPX – News) rose 11.53 points, or 1.06 percent, to 1,101.16. The Nasdaq Composite Index (Nasdaq:^IXIC – News) added 29.84 points, or 1.33 percent, to 2,273.80.

Indexes had fallen after U.S. homebuilder sentiment fell by the sharpest amount since the height of the financial crisis as a popular homebuyer tax credit expired.

Best Buy Co (NYSE:BBY – News) dropped 6.5 percent to $38.44 after its quarterly profits missed estimates.

Spain and Belgium sold government debt on healthy demand and Ireland issued bonds in auctions that soothed investor worries about the euro zone’s debt crisis.

(Reporting by Rodrigo Campos; editing by Jeffrey Benkoe)

http://finance.yahoo.com/news/Wall-Street-rises-with-euro-rb-1967056791.html